


Thanks Guru's,
Prazval.Ks
ü Open
Tableau Prep Builder
ü Open the
Superstore Sample flow
ü Click
the plus icon to the right of the "Clean 2" step
Select Add Script

ü In the Settings panel at the left edge of the Prep builder UI, Select "Tableau Python (TabPy) Server" as the Connection type
Click "Connect to Tableau Python (TabPy) Server"

ü Enter
"localhost" as the server and port 9004
ü Open
Visual Studio Code
Exercise
scenario: Sales management would like to gain insight on the revenue effect if
discounting. To support this, we will use Python to add a field to our flow
called "non-discounted sales".
In
this context, our Python script must be written with a function that can be
called from Prep Builder. We choose the name of this function. It will accept a
structure called a dataframe, and will return a dataframe.
ü Create a
new file called nds.ps (nds = non-discounted sales).
First
we'll simply print the dataframe to get a look at what our function will
receive from Prep Builder.
ü Add the
following Python code to nds.py:
def nds(df):
print(df)
return(df)
ü Save the
file to your Documents directory. (The location does not matter as long as you
can find it later.)
ü In the Prep
Builder configuration panel for the script added above, browse to the nds.py
file to connect this script step to your new Python script.
ü Look at
the command prompt running TabPy. You should see the results of the print
statement.

ü Let's
add our calculation. Replace
the print(df) statement with the following:
df['Non Discounted Sales'] = df['Sales'] / (1-df['Discount'])
This
line creates a new column in the dataframe called "Non Discounted
Sales".
ü Be sure
the two leading spaces are included. The Python specification requires the
contents of a function to be indented.
If
the schema of the returned dataframe does not exactly match that of the calling
dataframe, we need to include an additional function called
"get_output_schema".
In
this case we will return our new "Non Discounted Sales" column along
with the "Row ID" column so that we can join this column back into
the flow.
ü Add the
following to nds.ps:
def get_output_schema():
return pd.DataFrame({
'Row ID':
prep_int(),
'Non Discounted
Sales': prep_decimal()
})
ü Save the
file.
ü In Prep
Builder, in the flow, click off of the script step icon then back on it. This
will cause Prep Builder to re-execute the Python script.
You
should see the result of the script in Prep Builder.

Join the result of the script to the flow before the "Create Superstore Sales.tde" output step by dragging the “Clean 2” step icon over the “Non Discounted Sales” script step icon, and dropping it on the “Join” area that appears

Tableau
can pass code to TabPy through one of four different functions: SCRIPT_INT,
SCRIPT_REAL, SCRIPT_STR and SCRIPT_BOOL. Each of these accommodates a different
return type.
 In Tableau Desktop, Connect to the SuperStore sample
dataset
In Tableau Desktop, Connect to the SuperStore sample
dataset
ü Create a
calculated field by selecting the Analysis menu / Create a Calculated Field…
ü Name this new calculation as "City State" and with below Formula
SCRIPT_STR("
print(_arg1)
print(_arg2)
lst=[]
for i in range(0,len(_arg1)):
lst.append(_arg1[i]+',
'+_arg2[i])
return lst
",
ATTR([City]),ATTR([State])
)

ü Create a New worksheet and Drag:
year
of Order Date to columns.
Region to Rows,
Sales to rows.
Drag the calculated field "City State" to color.

Install Python
3/higher version from
https://anaconda.com/distribution
Anaconda is a convenient way to install Python plus Jupyter notebooks and all the tools needed.

ü At the Anaconda command prompt, type: “pip install tabpy”

ü At the Anaconda command prompt, type “pip install tabpy_client”
ü At the command prompt, start TabPy by typing: “tabpy”


Be sure to note on which port tabpy is running. This will be the last output line from startup.cmd.9004 is the default.
ü Open Tableau Desktop
ü To
connect Tableau Desktop to your TabPy server: Select the Help menu, then select Manage External
Service Connection

ü Enter
the server name or ip address of the machine on which TabPy is running. In this
case, "localhost" since it's running on the workstation that you are
using. Enter the port
number that you observed when you started TabPy (9004).
ü We have
not configured any security on our TabPy server, so leave the "sign in" and
"Require SSL" boxes unchecked.

Explain Data automatically provides AI-driven explanations for the value of a data point with a single click.
Based on advanced statistical models, explanations are
relevant and integrated, saving analysts’ time and enabling them to uncover
insights they may not have found otherwise.
While Explain Data can
help uncover and describe relationships in your data, it can't tell you what is causing those relationships.
How To Use Explain Data:-
This is a brief overview of how to use Explain Data.
Build
a visualization.
Make sure it uses a measure that is aggregated with SUM, AVG,
COUNT, or COUNTD.

Select
a mark.
Select
a mark of interest, and then click on the light bulb icon in the tooltip, or
right-click on the mark and select Explain Data.

Explore
the explanations.
If multiple explanations are available, click each explanation tab to
see the related details.
If there are multiple measures in the view, click each measure tab for
more explanations.

Open
the explanation in a new sheet.
Click the open icon in the top right corner of an explanation viz to
open the visualization as a new worksheet and explore the data further.


Hello Gurus,
In PowerBI the most important element is DAX(Data Analysis Expressions),which contains so many Function Types and their Functions.
So Having all the Functions and there Syntax in Single Page helps everyone in knowing all the functions.I'm posting all the Functions and there Syntax here.
1.DateTime Functions:-
Thanks Guru's,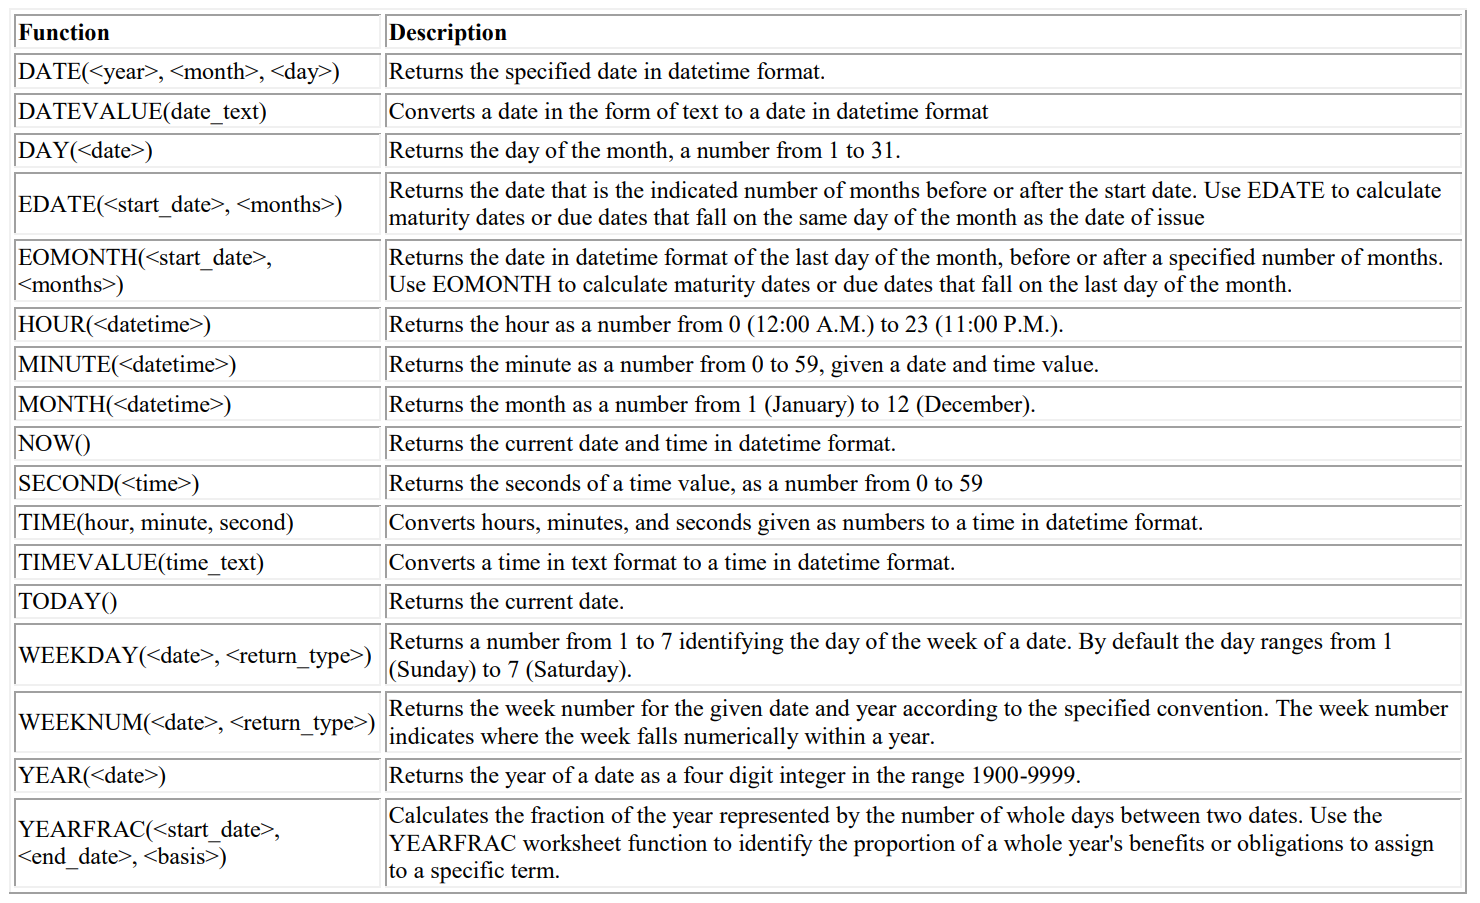
Add caption
Prazval.ks