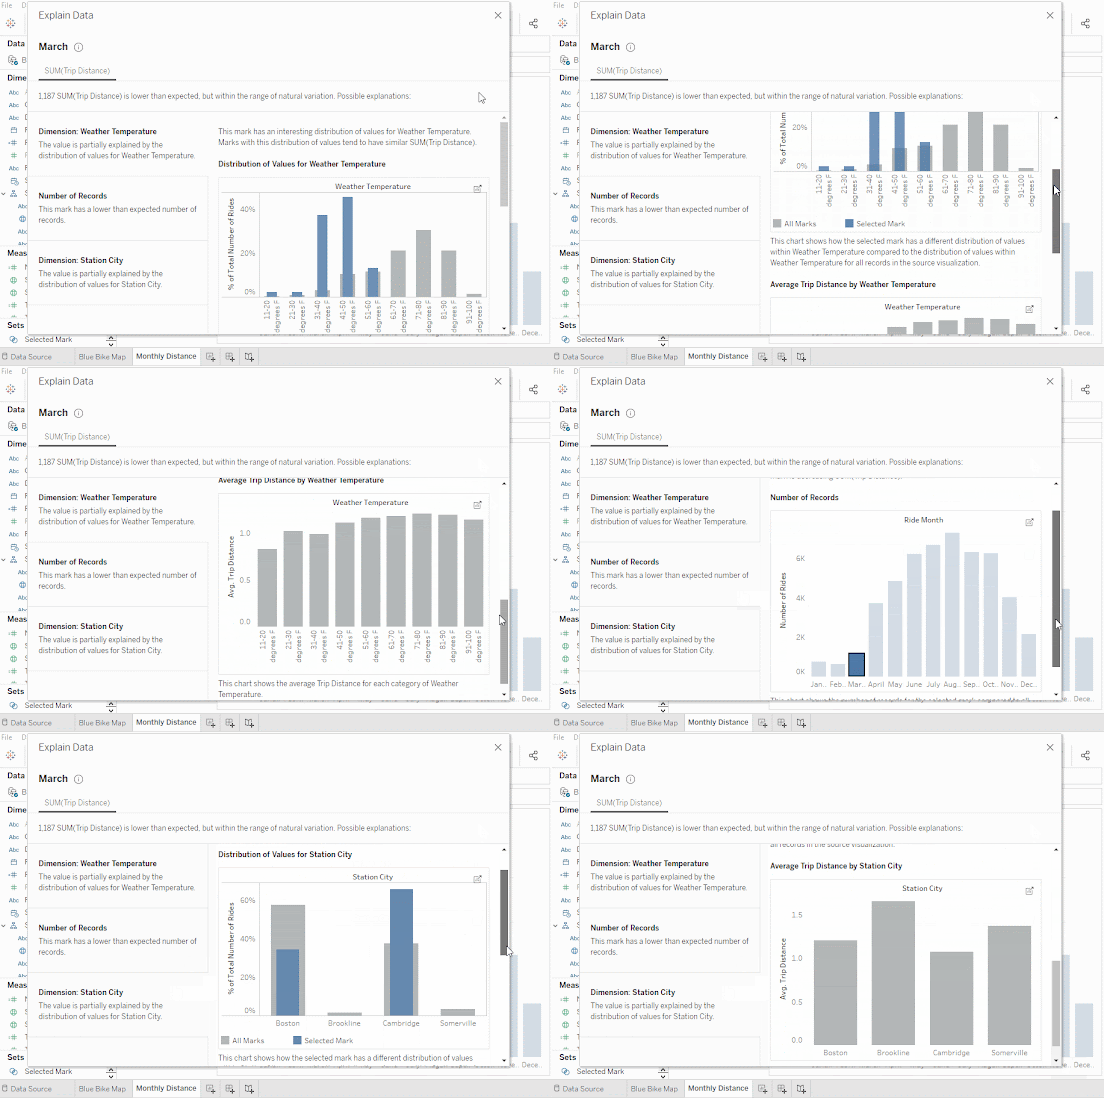
Explain Data:-
Explain Data automatically provides AI-driven explanations for the value of a data point with a single click.
Based on advanced statistical models, explanations are
relevant and integrated, saving analysts’ time and enabling them to uncover
insights they may not have found otherwise.
Explain Data
accelerates your exploration.
While Explain Data can
help uncover and describe relationships in your data, it can't tell you what is causing those relationships.
How To Use Explain Data:-
This is a brief overview of how to use Explain Data.
Build
a visualization.
Make sure it uses a measure that is aggregated with SUM, AVG,
COUNT, or COUNTD.
Select
a mark.
Select
a mark of interest, and then click on the light bulb icon in the tooltip, or
right-click on the mark and select Explain Data.
Explore
the explanations.
If multiple explanations are available, click each explanation tab to
see the related details.
If there are multiple measures in the view, click each measure tab for
more explanations.
Open
the explanation in a new sheet.
Click the open icon in the top right corner of an explanation viz to
open the visualization as a new worksheet and explore the data further.


