Friday 29 July 2016

Conditional Bump Chart in Tableau

On Bettings data(Click to Download):-
Create below bump chart of SUM(Daily amount bet) over continuous month of Bet date segmented by User group and Gender that meets the following conditions:
·         If the current month is greater than the same month of the previous year, add 1.
·         If the current month is greater than the previous month, add 2.
·         If the current month is less than the same month of the previous year, subtract 1.
·         If the current month is less than the previous month, subtract 2.


Step1: 
Drag Daily amount bet onto the rows shelf.  Drag Gender onto the columns shelf.  Drag User group onto the rows shelf and onto color.


Step2:
Right-click drag Bet date onto the columns shelf.  Select MONTH(Bet date).


Step3:
Change the mark type to area.


Step4:
Create the following calculation with name "Bump"


Step5:
Replace SUM(Daily amount bet) with "Bump" Field


Step6:
Click the  "Bump" field drop down > compute using > Bet date.


Final Output as below:


Thanks Guru's,
Prazval.ks


Thursday 28 July 2016

Variable Size Bump Chart in Tableau

Using Gambling Data(Click to download)
Create Following bump chart showing each Gambling product's rank based on AVG(Daily number of bets) over time (quarter of Bet date). Size the lines by the number of distinct Gambling products in each quarter


Step1:
Drag Bet date onto the columns shelf.  Select continuous quarter.

Step2:
Drag Gambling product onto color


Step3:
Create the following calculated field 


Step4:
Drag INDEX() into Rows. 


Step5:
Right-Click on INDEX() and select Edit table calculation.

Step6:
Select "Advanced..." from compute using drop-down.


Step7:
Select Addressing  by Quarter of Bet date and Gambling product in that order.  Sort by average Daily number of bets descending.


Step:8
Select “Quarter of Bet date” from the restarting every drop down.


   Right-click on  Index axis > edit axis…


Step9:
Select “Reversed” for the scale.


Step10:
 Create the following calculated field 


Step11:
Drag  "Size" onto size


Step12:
Click the drop down on the Size,Select  Compute using > Gambling product.


Step13:
Double-click on the size legend.


Step14:
Select “By range” from the sizes vary drop down.


The desired output as below:


Thanks Guru's,
Prazval.ks


Thursday 21 July 2016

Finding Renewal of subscriptions

Design a view to see all of my customers who have returned and bought again over time.(Renewals).


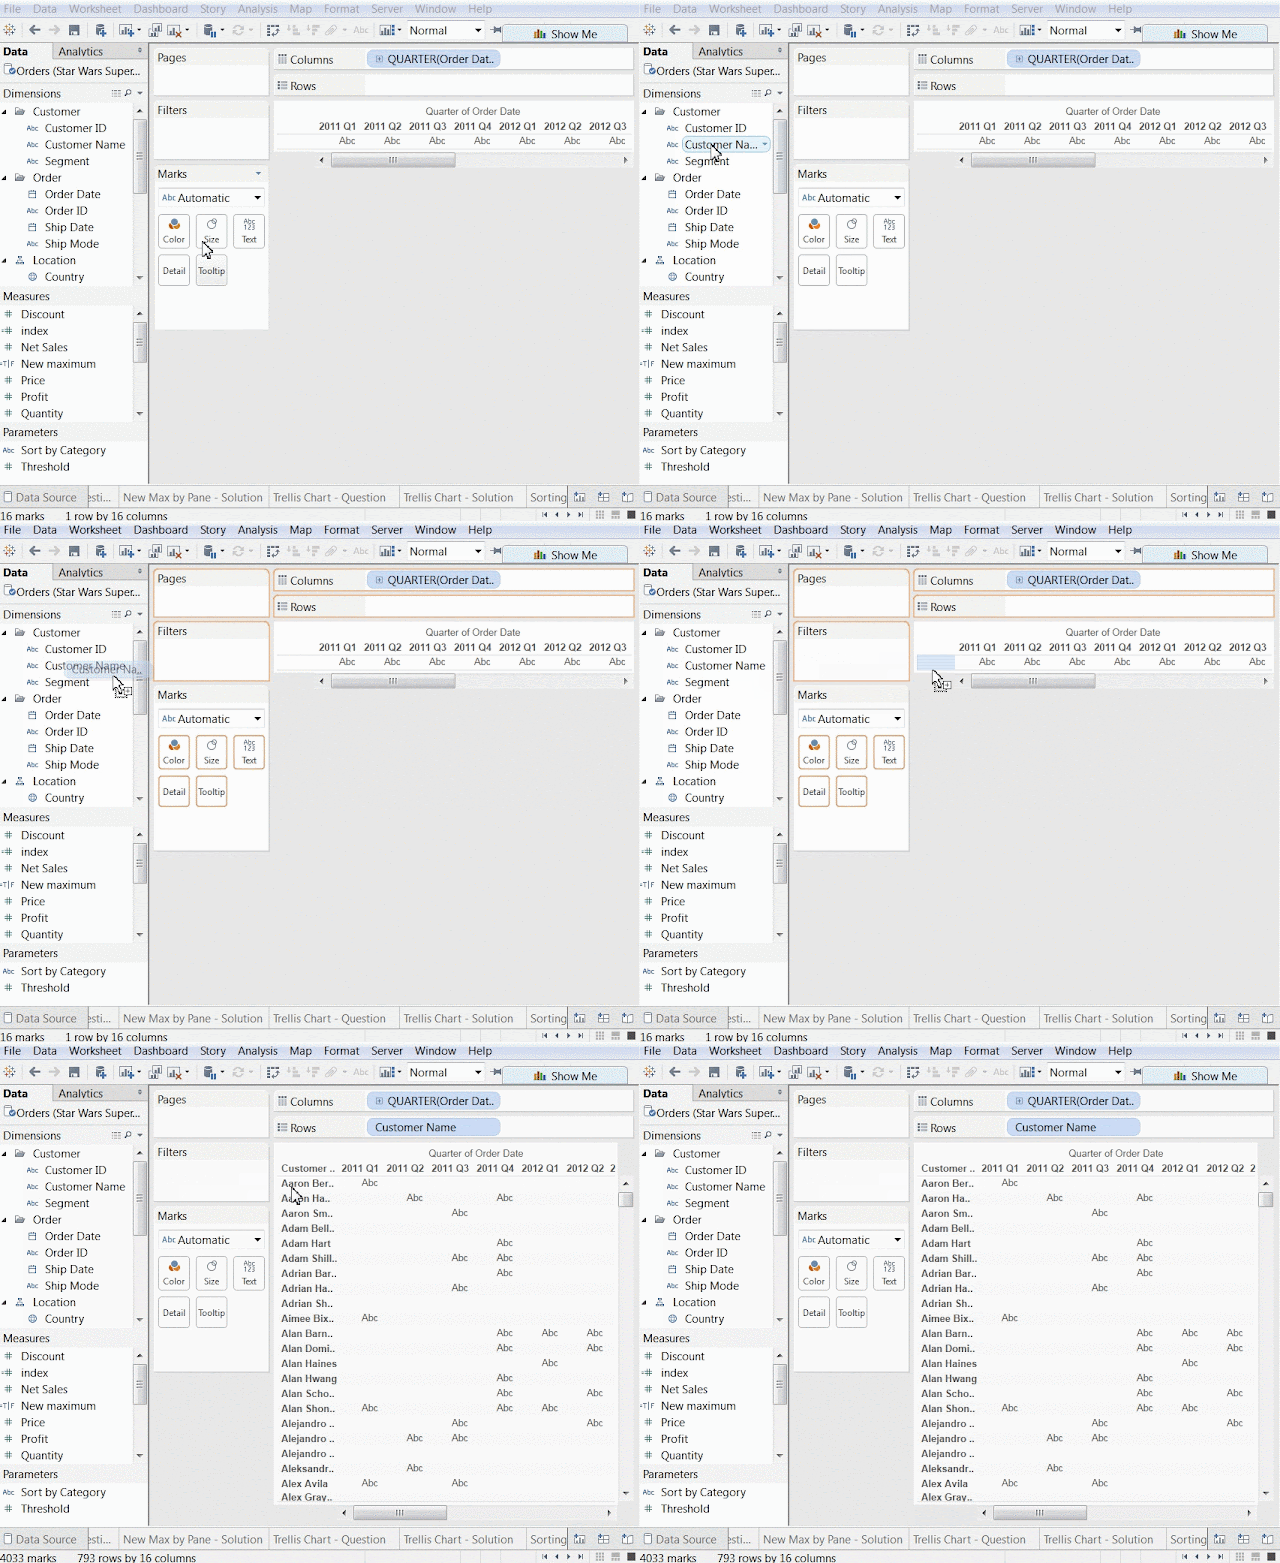
Step 1:- 
Add quarters to columns (right click and drag for dialogue box to open) 


Step 2:-
Add Customer Name to rows 


Step 3:-

Count customers who have renewed

Create a calculation that checks if the customer's current purchase is greater than 0 and if the previous purchase was greater than 0. 

In other words, did the customer purchase more than once in a row?


Step 4: 

Count customers who have renewed only once

  Step 4.1: 
  Create a calculation that sums up the counts of renewals 
  Step 4.2:
   Modify the calculation so that only one instance of the sum      of renewals remains.  

     Step 4.3: 
     Compute each calculation appropriately.


Step5:

Create final viz

  Step 5.1:
  Put Final Renewals on the Rows shelf


    Step 5.2: 
    Put Customer Name on Details 


     Step 4.3:
     Break Final Renewals up by Segment. 


Thanks Guru's,
Prazval.ks


Sorting on Table Calc

How to Sort  Order Date quarters based on a table calculation. This puts the chronology of the dates out of order, but allows us to see which dates had the largest changes. Also Dynamically choose the department to sort the difference calculation on.


Note:-
It is not possible to sort on a table calculation from a dimension in the sorting options and the default sorting will not work.


Step 1:-

Create a parameter that includes all of the Category items. 


Step 2:-

Create calculation that returns the sales of a particular category


Step 3:-

Drag "Selected Sales LOD" on Rows Shelf, convert to Discrete, and place in front of Order Date on Rows Shelf. 


Step 4:-

Use quick table calculations to convert the LOD to a Difference calculation. 


Step 5:-

Swap the dimensions on the row shelf to sort by your  calculation. 


Deselect "Show Header". 


Right click on the created parameter, and "Show Parameter Control". 


Thanks Guru's,
Prazval.ks


Cohort Analysis

Find out how many of our customers are coming back after their first purchase. We need to group the customers by when the made their first purchase as well as where they made their first purchase.


Step 1: 

Find the first Order Date for each Customer by finding the minimum Order Date per Customer. 


Step 2: 

Find the region each customer first bought in


Step 3: Calculate percent difference 

 Step 3.1: First create the Current Count calculation.


   Step 3.2: Next create the Cohort Count calculation


    Step 3.3: 
    Find the percent difference between the number of returned     customers each month and the total count of customers in         the cohort. 


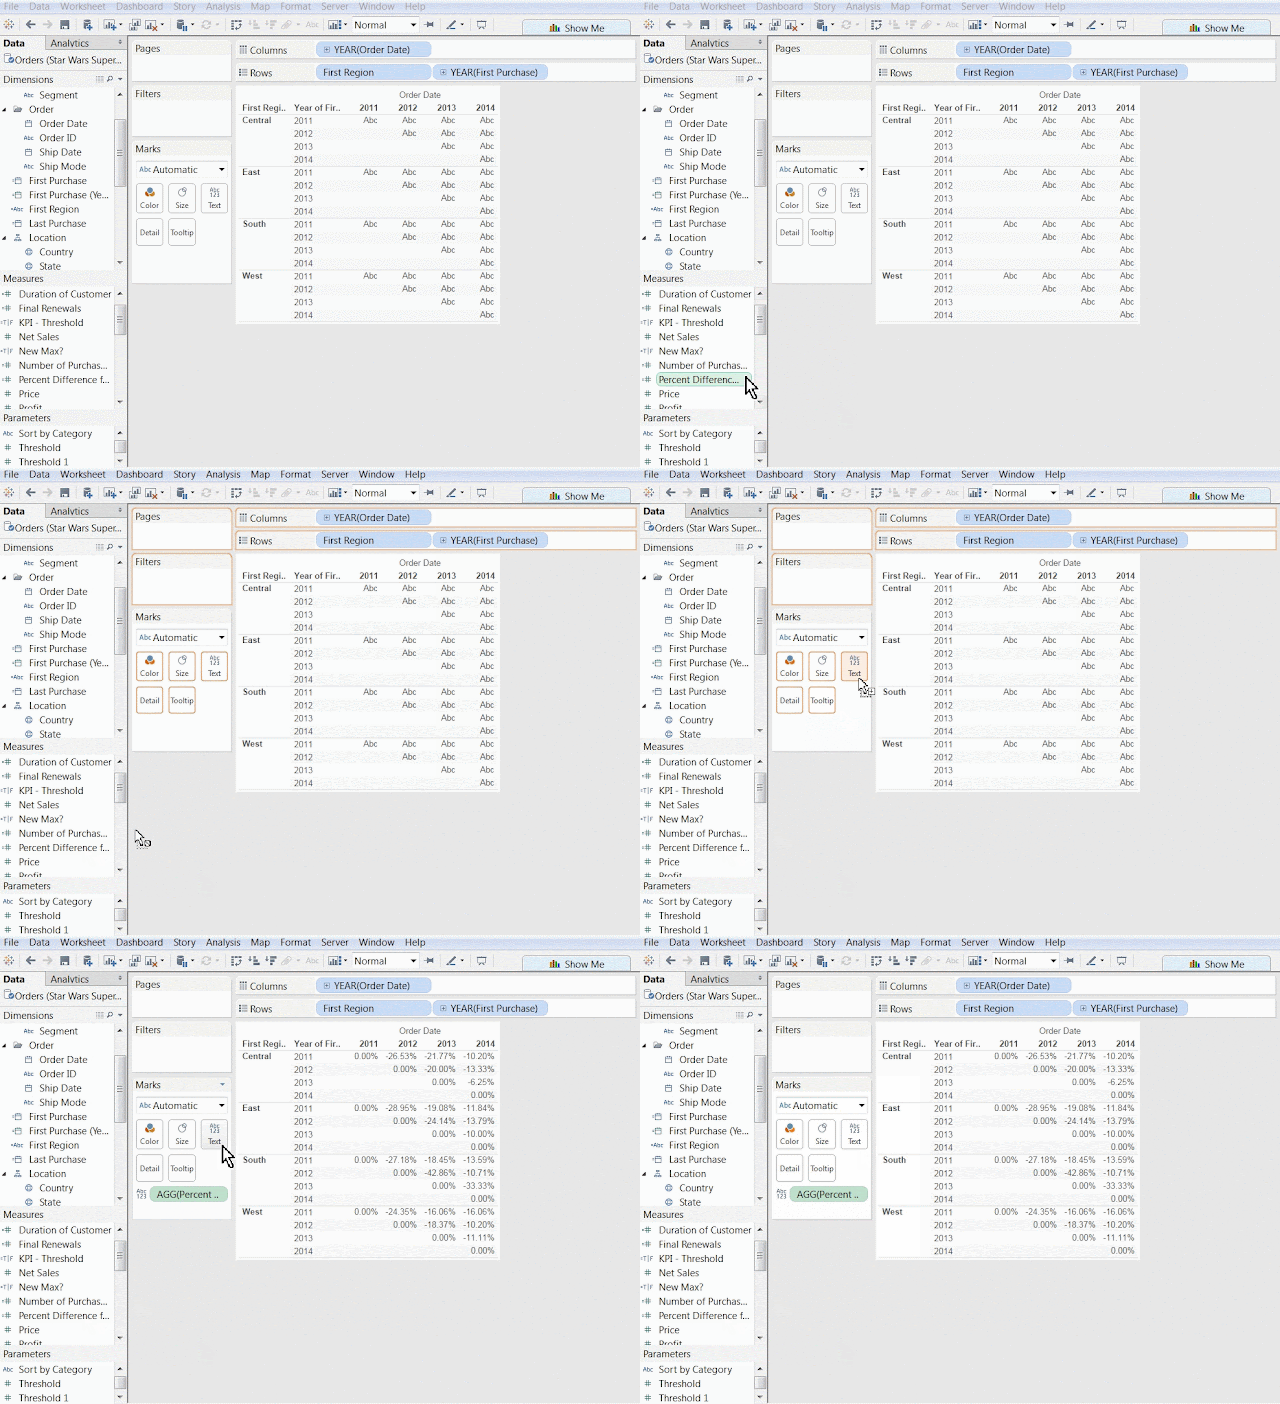
Step 4: Design a View

 Drag "Order Date" on Columns and "First Purchase date" on Rows. 


Drag "First region" on Rows.


 Drag "Percent from First purchase" on Text for final output. 


Thanks Guru's,
Prazval.ks

DAX Time Intelligence Functions

   Thanks Guru's, Prazval.Ks