Find out how many of our customers are coming back after their first purchase. We need to group the customers by when the made their first purchase as well as where they made their first purchase.


Thanks Guru's,
Prazval.ks

Step 1:
Find the first Order Date for each Customer by finding the minimum Order Date per Customer.

Step 2:
Find the region each customer first bought in

Step 3: Calculate percent difference
Step 3.1: First create the Current Count calculation.

Step 3.2: Next create the Cohort Count calculation

Step 3.3:
Find the percent difference between the number of returned customers each month and the total count of customers in the cohort.

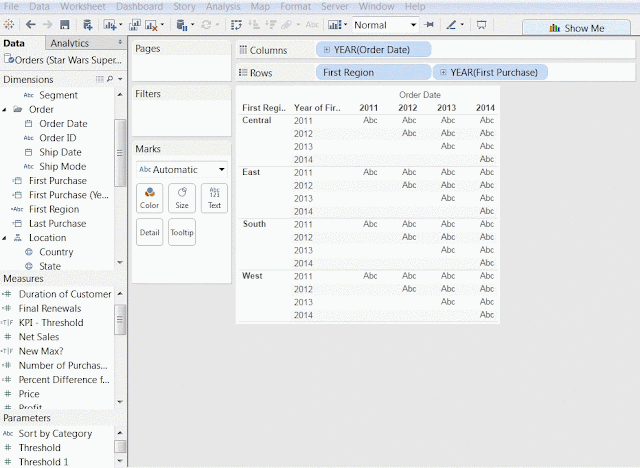
Step 4: Design a View
Drag "Order Date" on Columns and "First Purchase date" on Rows.

Drag "First region" on Rows.

Drag "Percent from First purchase" on Text for final output.

Thanks Guru's,
Prazval.ks
