Design a trellis chart with 7x7 grid of pie charts for Category and Sales for all states in "Superstore Excel" as Below.
Step 1:
Create X and Y axes Calculated Fields to Get 7x7 Grid.
Above X-Axis logic will combine every 7 Values together in a row.
Above Y-Axis logic will count values from Top to Bottom and restart for every 7th Value.
Step 2:
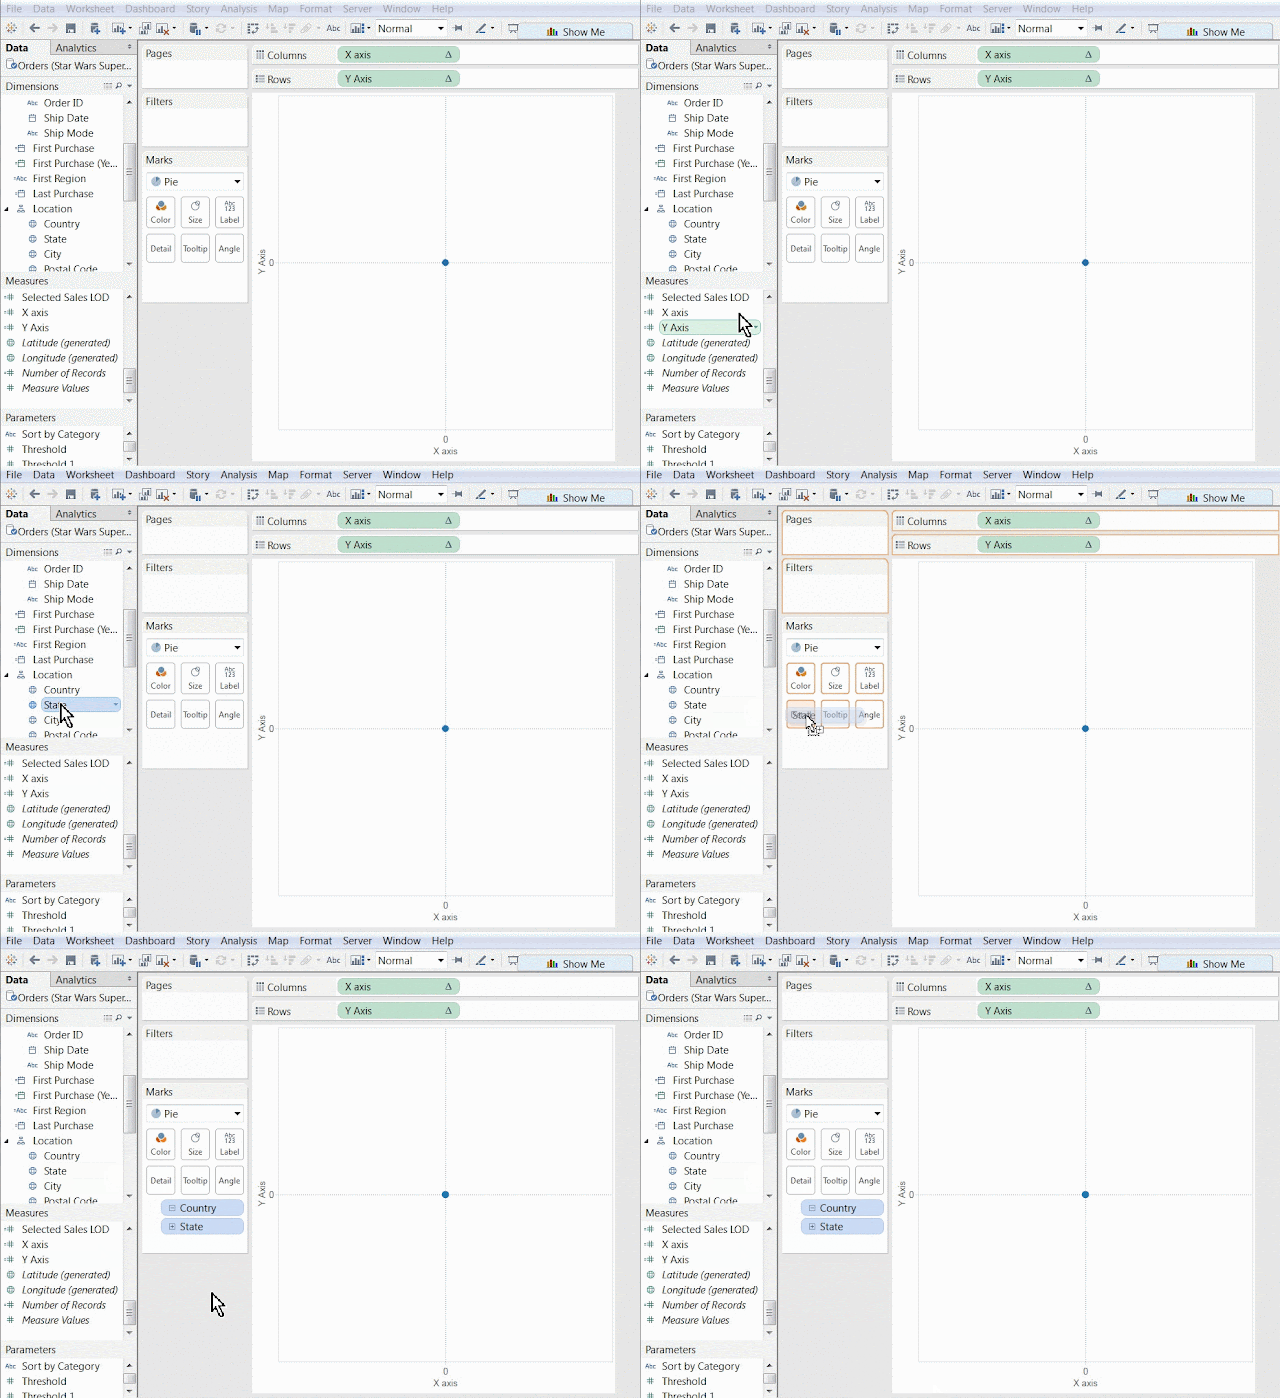
Design worksheet with following steps.
Drag X axis to Columns and Y axis to Rows.
Change the chart type to a Pie Chart.
Drag&Drop State on Detail
Set the X and Y axes to "Compute Using..." --> State.
Step 3:
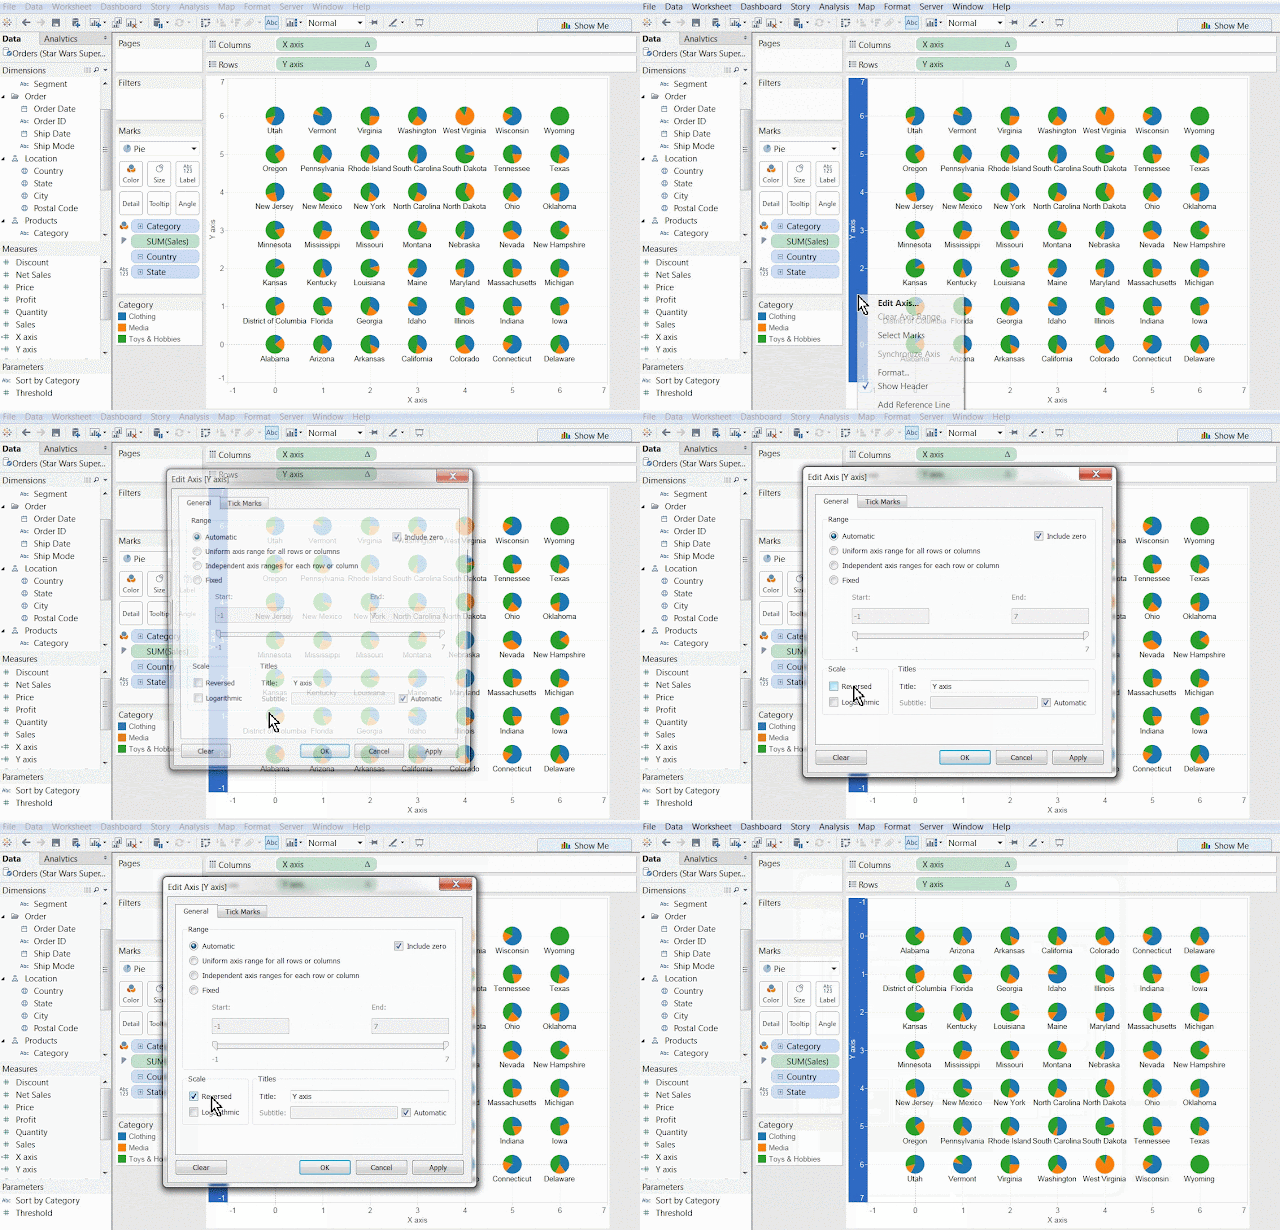
Create the Pie Charts
Increase the size of the circles.
Drag Category on Color and Sales on Angle.
Put State on Label.
Reverse the Y axis. Finally it displays the desired output.
Remove axes.
Thanks Guru's,
Prazval.ks


